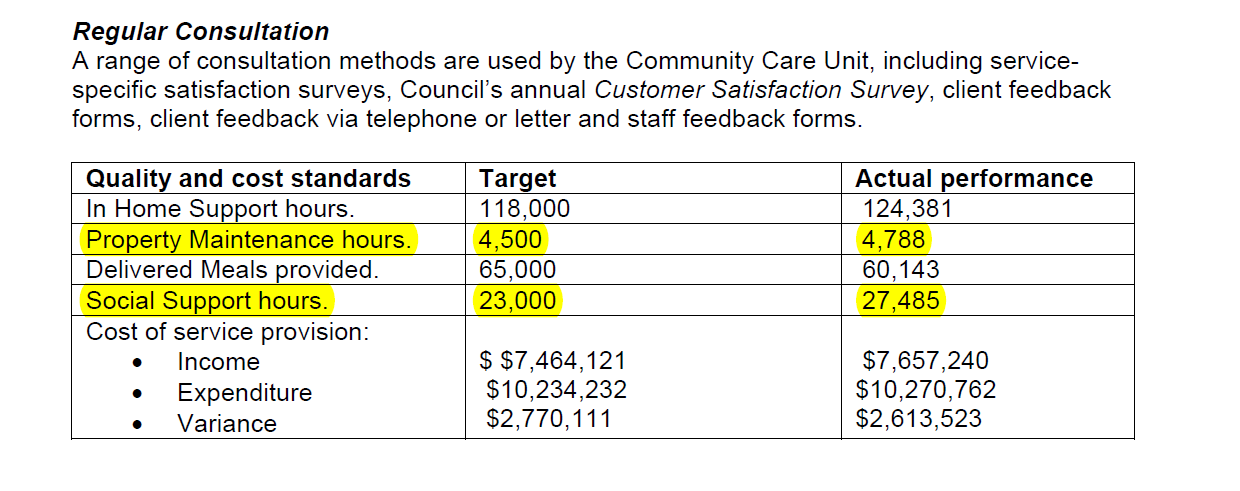
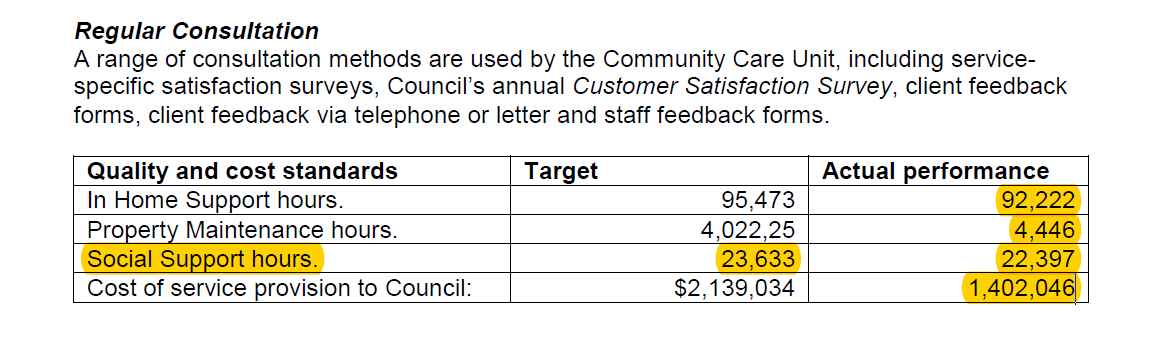
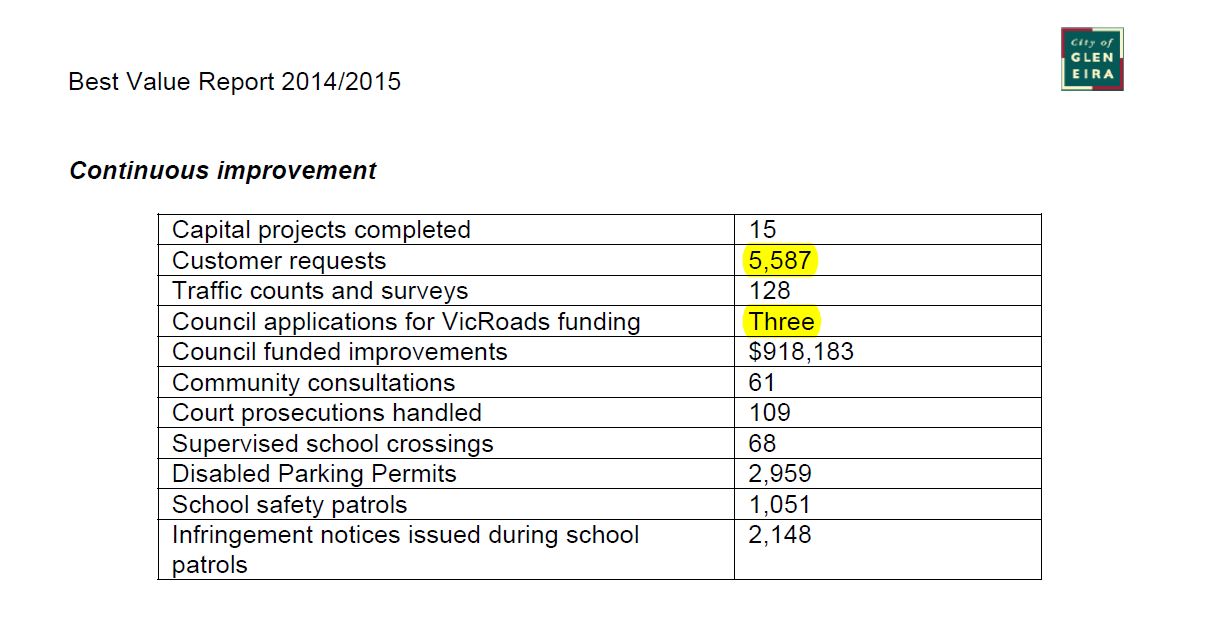
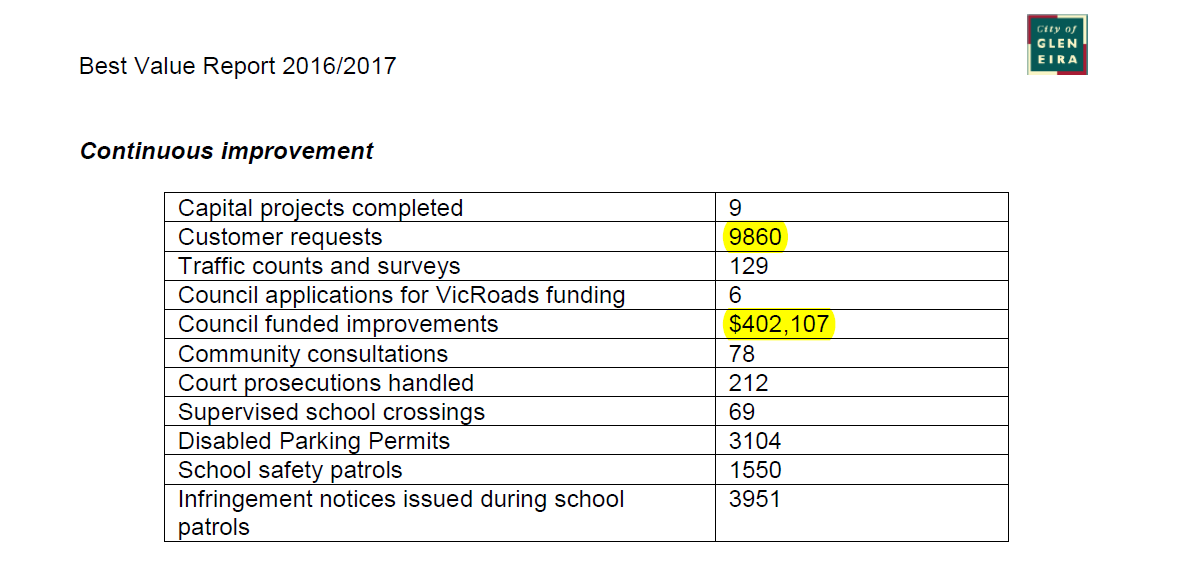
Words are not really necessary for this post. Readers should merely compare the results from 2014/15 to 2016/17 and assess whether these Best Value reports do reveal ‘continuous improvement’ by council and as mandated by the Local Government Act. We have chosen Traffic/Parking and Home Care . The 2014/15 reports are presented first.
Click on each image to enlarge

October 24, 2017 at 11:50 AM
Going backwards at a great rate is what this shows. Nearly double the requests on traffic and half the number of jobs done and half spent by council in three years and this has been done when they know that traffic and parking are one of the biggest complaints of residents and has been for years. All they care about is getting more fines and taking people to court instead of fixing the problems.
October 24, 2017 at 3:29 PM
Double requests should involve double traffic counts and surveys. Only conclusion is that they chose to totally ignore the majority of requests! All this in spite of more cars, less parking.
October 24, 2017 at 12:05 PM
Anyone notice the amount of empty beer bottle around the streets outside Caulfield Racecourse. I thought it was a dry zone
October 24, 2017 at 1:56 PM
School patrol infringements nearly doubling. Presumably Council consider that an “improvement” rather than providing a clear indication of widepsread parking problems?
October 24, 2017 at 5:29 PM
noticed the same thing. more people, more cars, more fines. Wonder what the infringements have been for outside school patrols.
October 24, 2017 at 3:30 PM
Did the Anon. experience a body and bag search on station street during the so called carnival. My aged husband on the way from the Station to our home had his path blocked by the “yellow coats” to perform examination on him like everyone on the public footpath., racegoers or not… yet a further takeover of public property and denial of freedom of movement.
October 24, 2017 at 4:03 PM
Why has council funded improvements dropped 44 % ? is council saying they don’t need to spend so much money? was the saving directed elsewhere and if so to what project. Gee our councillors don’t appear to ask many question do they? its all to hard for them!!!!!
October 24, 2017 at 5:32 PM
These are supposed to be “quality and cost standards”. None of this is defined. I’d like to know how they come up with the target figures to begin with. If we’ve got an ageing population then I’d expect that home support hours should increase, not decrease. The costs on the other hand for both years don’t make sense to me unless there have been huge staff cuts to explain the lack of hours. Even this shouldn’t equal $1.2 million. I’m working on about $40 per hour and with the numbers council has quoted, it doesn’t even come close to the million. It’s very easy for council to write up figures that are positive and residents have no way of checking if these are true and accurate.
October 24, 2017 at 8:03 PM
Council’s interpretation of continuous improvement is to change the goal posts (targets), charge more for the same thing, and then crow about how cost efficient they are.