We admit that we are not statisticians, planners, nor demographers. We’re just ordinary residents with some modicum of intelligence trying to understand the inconsistency and unexplained assumptions in so much of council’s data.
Council admits to basing its current planning on prognostications about future housing needs. They are basically working on a formula which states that roughly another 9000 net new dwellings are required by the end of 2031 which becomes an average of 600 per year – totally ignoring of course the fact that for the past 3 years at least this figure has been close to triple!
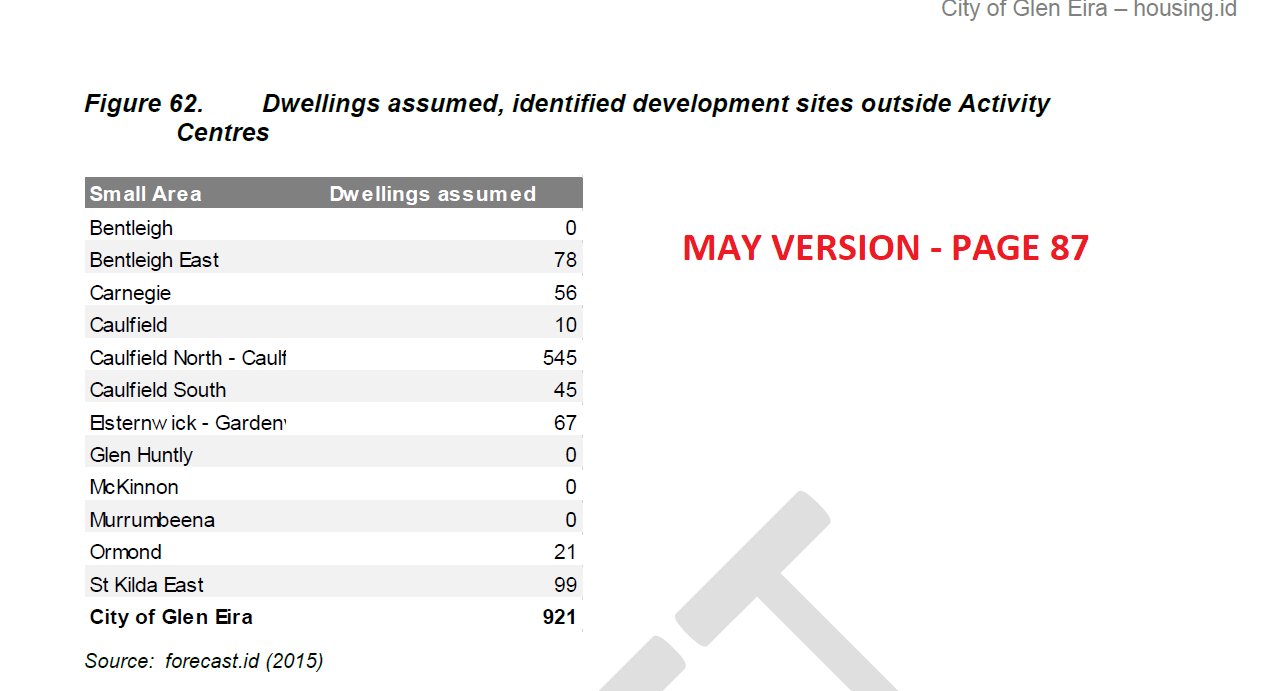
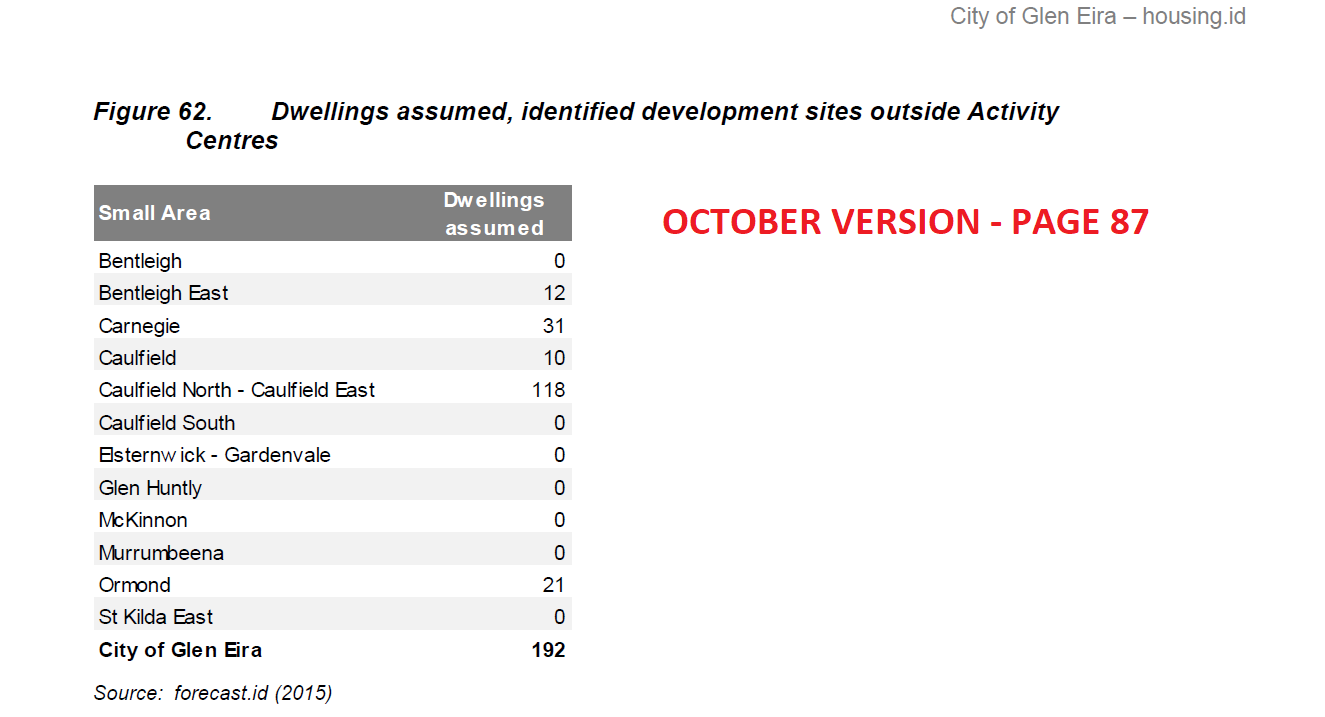
Confounding the analysis even further we find that figures over a period of 5 months are indeed very ‘flexible’ – again with no explanations proffered. Below are a couple of screen dumps from the Housing Id reports. The first one is dated as May 2017 and the second one is dated October 2017.
When comparing these two sets of figures, please consider:
- The criteria for both sets of figures are identical (ie 2015) – so why the difference?
- The ‘study areas’ are identical
- Since nothing has changed in the planning scheme (ie no new amendments apart from Wynne’s VC110 and those applications coming in post VC110 are still to be decided) – why the difference?
- If we accept 500 for Caulfield Village as now developed, then why not add in another 1000 plus as ‘development sites’ for the rest of Caulfield Village?
- ‘outside activity centres’ would basically mean minimal change areas. Have we really had major multi unit development so that in 5 months we find Bentleigh East for example going from 78 sites down to 12?
The most questionable aspect of all the above is to be found in the differing May and October conclusions. Note that we’re told that there is capacity for 4018 dwellings as ‘infill capacity’. In May this was given as only ‘outside’ activity centres. The October version figure is identical. So what’s happened to all those potential areas outside the expanded activity centre zones? Or was the May figure already a clear sign that council intended to double the size of activity centres but without being upfront about this to residents?

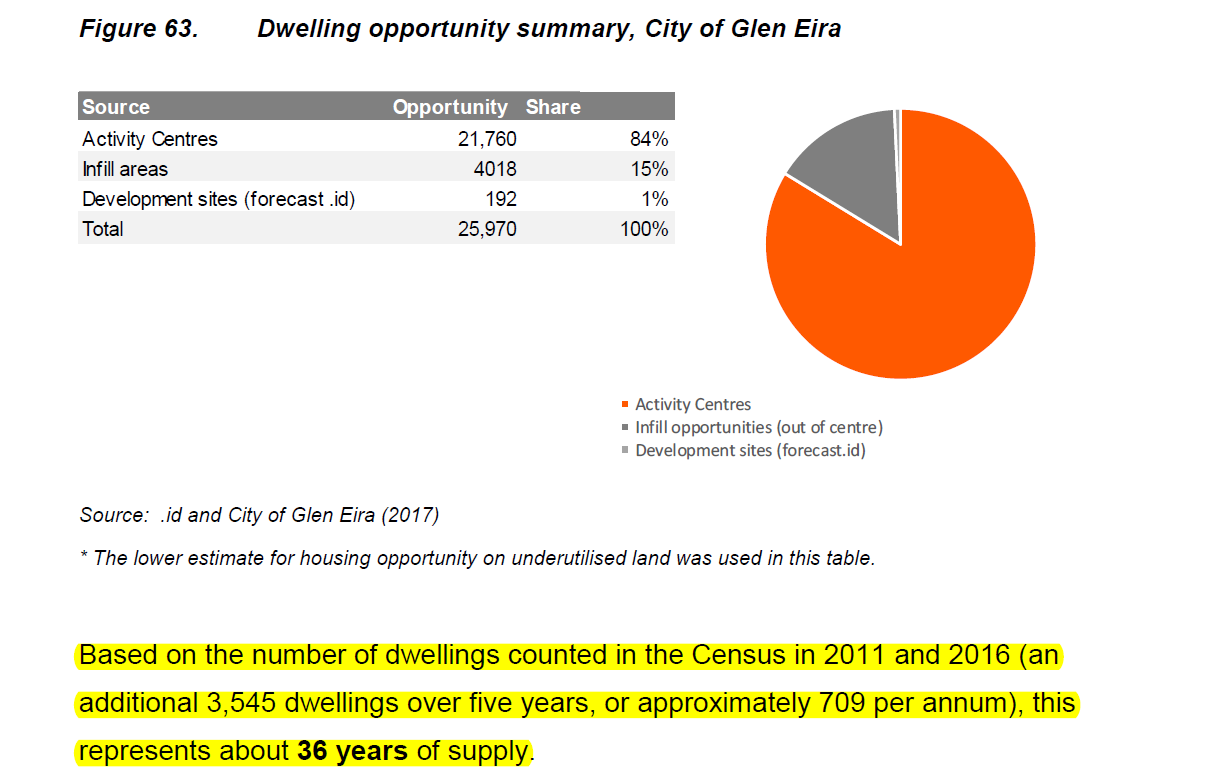
More unfathomable is the claim that even with the admitted 3000 (preliminary) figures for Virginia Estate, this only reduces the ‘years of supply’ by 1 – from 37 years in May, to 36 years in October! Plus, how can the May figure tell us that there is an average of 713 dwellings per annum which equals 37 years supply and the October figure tells us that there is now an average of 709 per annum but the supply has dropped by a year? Surely if the average per year goes down, then the overall years of supply must go up not down?
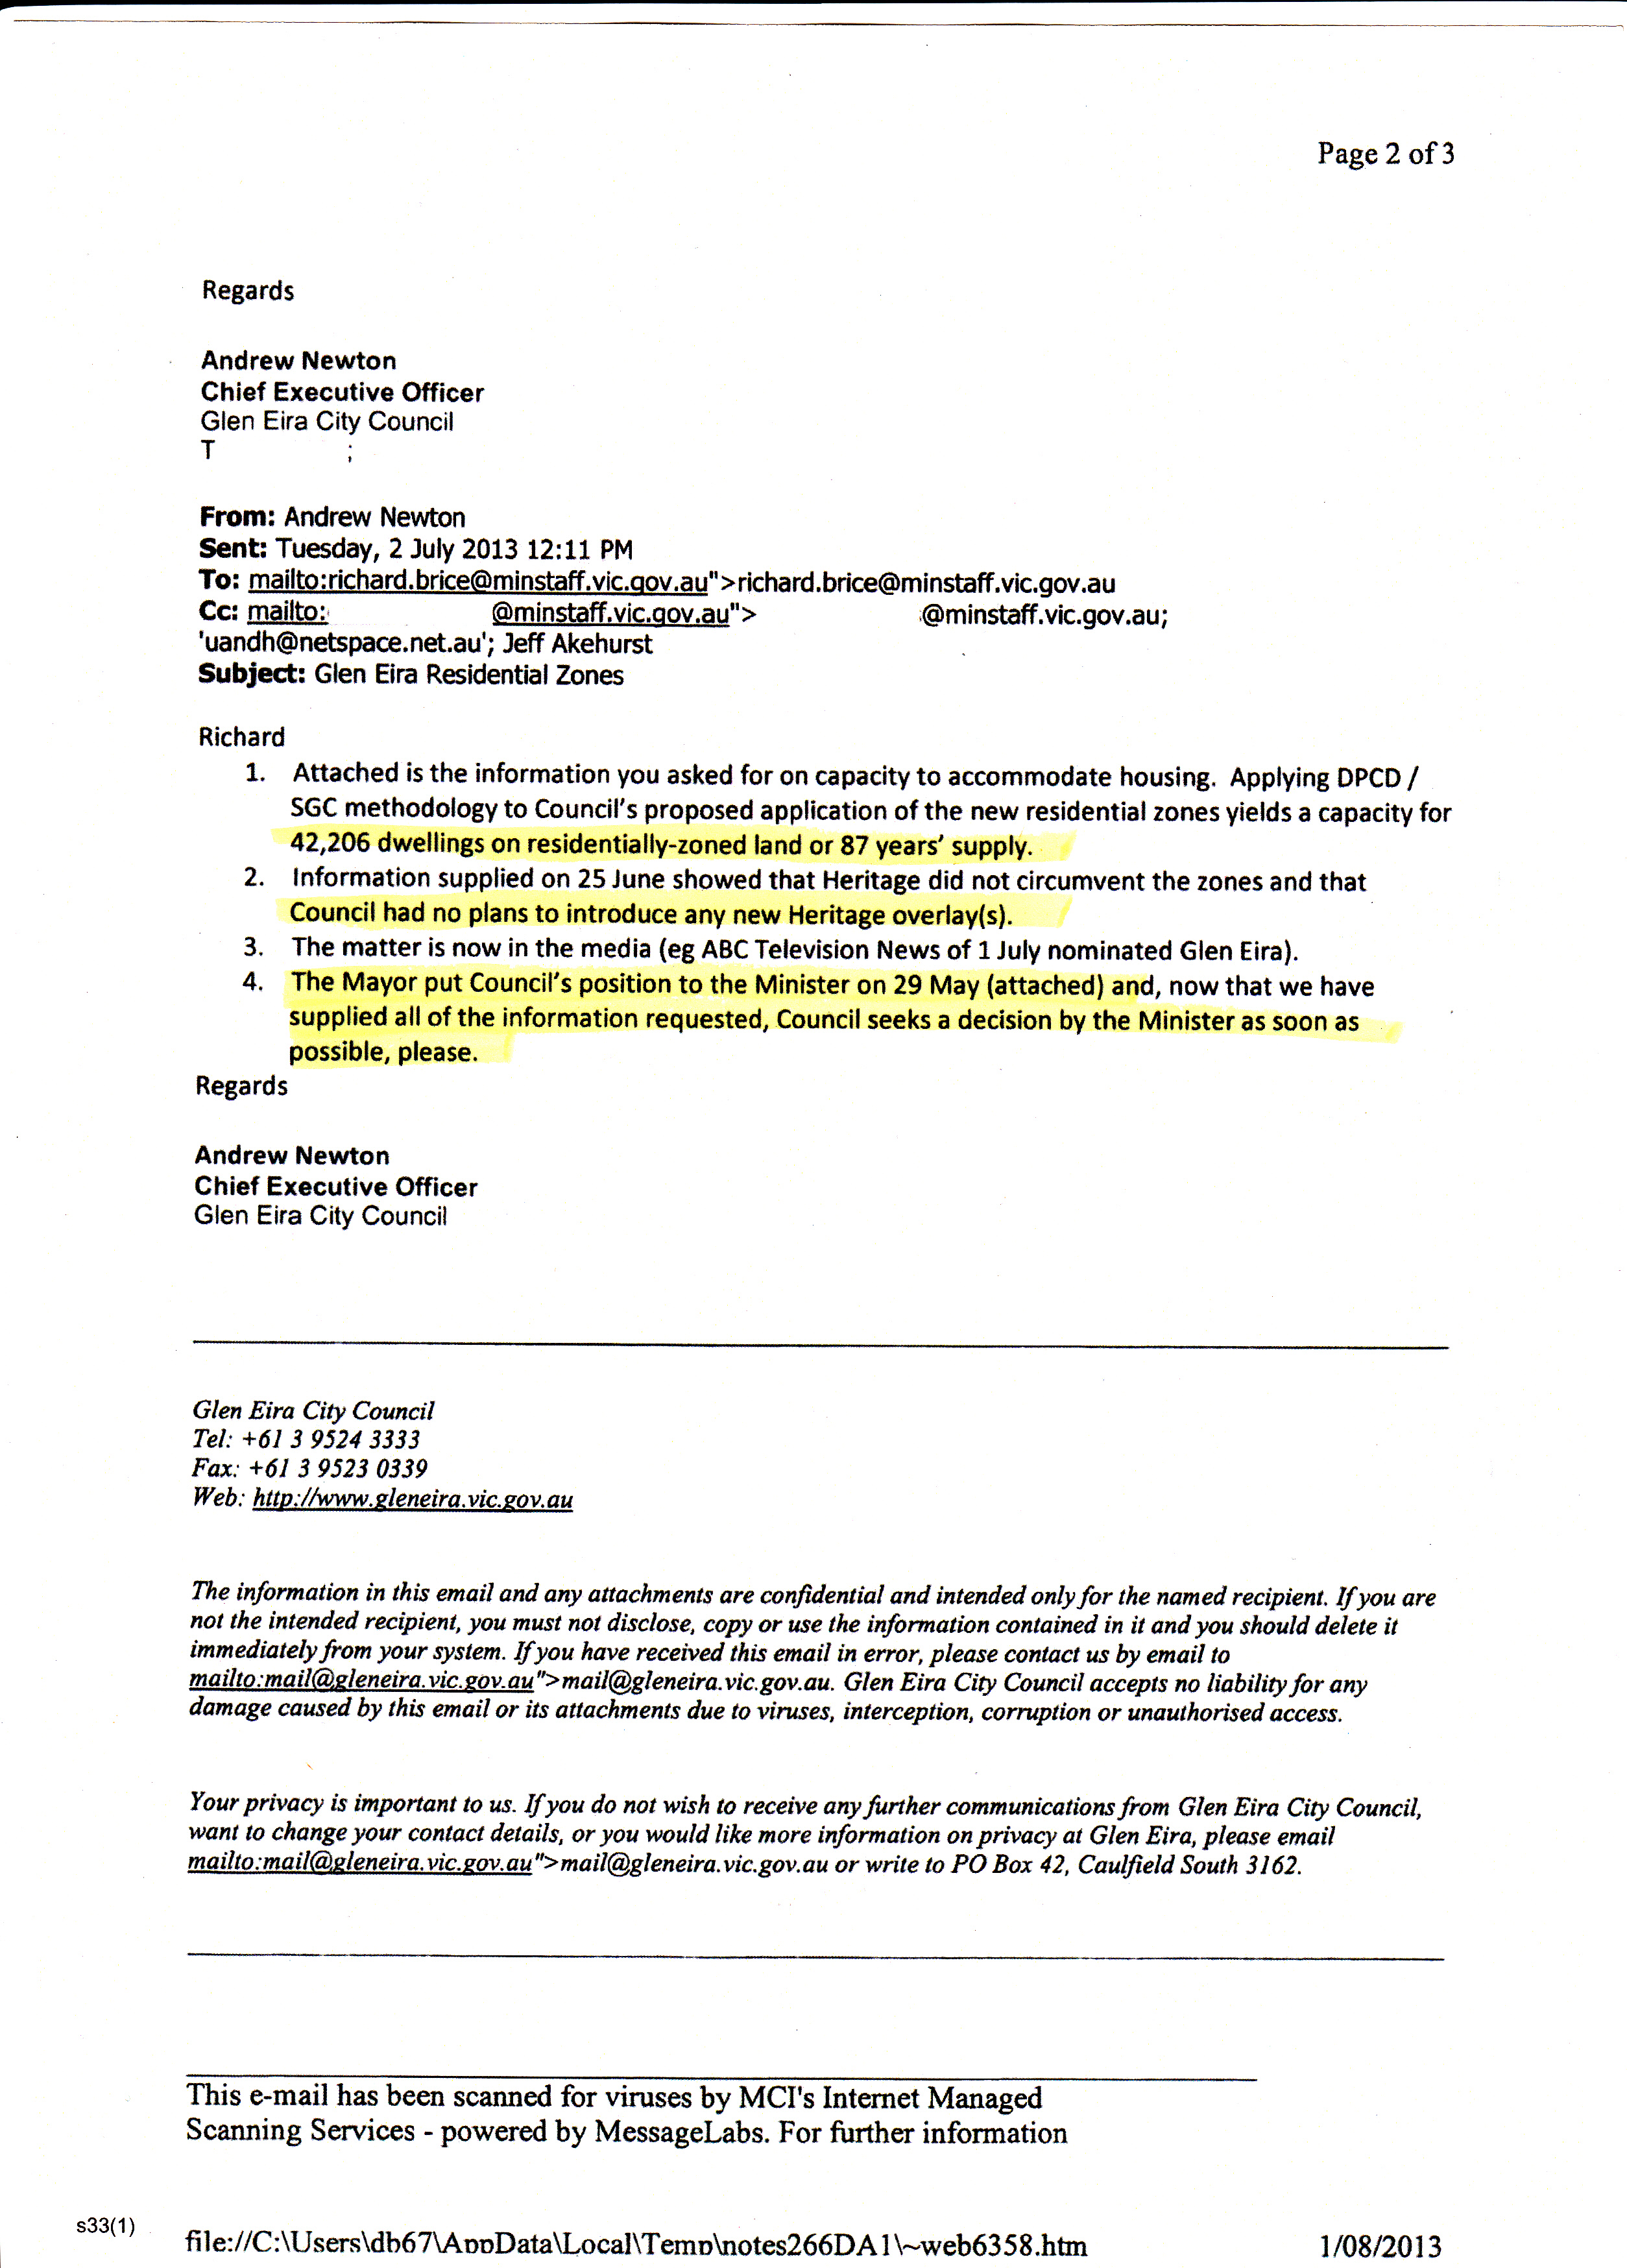
To show how rubbery every single figure is, we republish an email from Newton to the Department written in July 2013 – before the zones were gazetted. The claim then was that with the new zones Glen Eira would have 87 years of supply and over 100 years once commercial was included. With the new zoning, Newton trotted out a figure of a 42000 dwelling supply. If true, does this therefore mean that since 2013 Glen Eira has experienced the equivalent of 14000 dwellings in the space of 4 years? Certainly not! So how much faith can be placed in anything that council produces? And why is council even considering 87, 37, or 36 years down the track when no government is doing this with housing!


November 12, 2017 at 2:21 PM
crap figures that don’t make sense.
We need 600 per year so why the 12 story heights and huge activity centres with stacks more homes up for higher to.
87 and 106 years or 37 or 36. Take pick. They are all crap.
November 12, 2017 at 3:51 PM
Until they address the issue of future projections the structure plan process has no credibility at all and the background documents are just worthless.
November 12, 2017 at 5:15 PM
It all about perpetual growth, growth for the sake of growth and profit if you haven’t noticed the two major political parties are locked into the growth model. They know there is an endless queue of people waiting to hop onto a plane and make their way to Glen Eira, rent an apartment, tomorrow.
There will be no complaints about planning, traffic, rates garbage, they are by default model residents, and to delight of politician they cannot vote.
Albert Einstein said “Insanity is doing the same thing over and over again and expecting different results. For the sake of sanity we should try something else, an alternative, or we will get more of the same, over and over again.
November 12, 2017 at 5:28 PM
Meaningless requirements. What if we have many more dwellings than required ? Will the developers be told to go elsewhere. I say not more over development in Glen Eira.
November 12, 2017 at 6:22 PM
More dwellings than required you say?
1300 empty properties in Glen Eira, presumably many of them purely “land banked”.
http://www.theage.com.au/victoria/pretty-vacant-20000-properties-empty-across-inner-melbourne-20171109-gzi55w.html
A proper crackdown on foreign investment would be a good start and would ease the supposed pressure to build and build and build.
November 12, 2017 at 9:15 PM
Census puts numbers of unoccupied at 8.9%.
November 12, 2017 at 6:54 PM
The growth rates in GE are greater than in other areas. While the CEO distributes propaganda, at rate payers expense, saying it’s due to Melbourne population pressures the reality is different. If the Council has any integrity they would ackowledge that the excessive GE population growth is due to lack of policy resulting in a more developer friendly environment than other Councils. Weak policy equals weak controls and out of control development. Problem with Council is that they wont even acknowledge what’s currently happening with development rates. Just not good enough. Waisting rate payers money on heaps of reports that don’t even address the most important questions.
November 12, 2017 at 7:38 PM
Poor id consulting. Might teach them not to rely so much on what Glen Eira feeds them and do their own double checking.
November 13, 2017 at 7:11 AM
In trying to sell a story to residents, they have successfully bamboozled themselves. Poor id consulting indeed, guilt by association with a Council with agendas that can’t be explained.
November 13, 2017 at 9:03 AM
Noticed something else weird. Activity centre numbers have gone up from May. Size of activity centres hasn’t changed & the latest effort is supposed to reduce the areas of growth. How come we get more.
November 13, 2017 at 10:59 AM
http://www.haveyoursaygleneira.com.au/treeregister
Council is wanting you the public to comment on their Classified Tree Register.
It’s important to save mature trees, as it important to plant new trees for the future.
Glen Eira is suffering serious tree decline coupled with higher density levels, more traffic and everything else that comes with rapid and to some extent uncontrolled development; that refuses to acknowledge let alone implement any sustainable living practices that may ameliorate some of the downside of higher density living .
Glen Eira bureaucrats excel at tokenism. And I suspect this Tree Register will be token window dressing as well.
But still, go online and put forwards your feeling on why you value trees in your neighbourhood.
November 14, 2017 at 1:51 PM
There is so much that needs explaining. The documentary evidence shows Newton and Akehurst making claims on behalf of Council without the delegated authority to do so. Clearly there was collusion to make unilateral changes to the planning scheme without public scrutiny. Ex-mayor Hyams hasn’t been forthcoming.
There is no methodology. Whatever the “DPCD/SGC methodology” is claimed to be, the public haven’t seen it and we have been given numbers that span from 35 years to 106 years. The evidence all points to the lack of a consistent methodology. Despite what the Local Government Act and Councillor Code of Conduct says, there is very little transparency or accountability in the way Council operates.
Remember too that Council has refused to explain why it wants to expand activity centres and weaken residential amenity protection to achieve at least 35 to 106 years of supply [at “current development rate”]. Sadly if that supply was consumed in only a few years, something that Council can’t control, the Government would simply impose a new target of a further X%. The Municipal Strategic Statement tells us that the State Government estimates our population will be 130064 in 2021. VCAT disagrees, as does ABS.
BTW we are now copping a new marketing blitz from the Andrews government about Skyrail. My prediction is that there will be no document showing what the proposed linear space might look like when 4 tracks are in place. Nobody will be able to play football on any of the “11 MCGs”. Carnegie is to get only 13 new car spaces, so Council will keep in place the parking restrictions in its minimal change areas. Vehicles will continue to park across residents’ driveways.