GE Council Meeting(s)


The last time the community was permitted to provide input into a planning scheme review was in 2016. Thus ten years have passed, three previous reviews have come and gone and council still sees no need to allow residents to have their say on this important document which is up for decision at Tuesday’s council meeting.

The main argument council provides for the refusal to allow ‘consultation’ is (and we quote) –

Given the short time frame set by DTP, there was insufficient time to engage with the community.

However, once the Planning Scheme Review Report is endorsed by Council it will be published on Council’s website. (!!!!!!!!!!)

Council tells us that they received the order from the Minister in January 2026 that the review was to be completed by the end of October. That is a full 9 months! Ironically, when a public question was asked on the 2/5/2023 in regards to community consultation for the upcoming 2023 planning scheme review, the final paragraph of council’s answer was:

Council officers regularly brief Department of Transport and Planning representatives on the progress of our strategic planning work program and have committed to provide a review within 6 months to the Department. Once the internal review is nearing completion, Council will be in a better position to confirm the nature of any further consultation.

Needless to say, there was no community consultation then! However, council still thought that it could get things done in 6 months! Now they have 9, and we assume ongoing ‘discussions’ with the department and Minister have continued, but this isn’t enough to engage the community in 2026!

We certainly acknowledge that the last 18 months or so has seen a landslide of government changes to the planning scheme, all of which have, and will have, a dramatic impact on councils. But it’s not as if councils weren’t forewarned as to what was happening. Submissions were asked for and sent off, as well as continued ‘advocacy’.  

Thankfully, not all councils operate as Glen Eira does. To various extents, they value their communities and do provide them with the opportunity to have a say!

The following group of councils are ALL providing community consultations for their 2026 Planning Scheme Reviews. Most are regional councils so may not be impacted as severely with the Activity Centre changes as our metropolitan neighbours. But they do have their own issues to deal with that have been impacted by legislative changes – ie huge population growth in many, environment, etc.

We should also point out that not all councils have released their reviews and the processes involved. Some have asked for extensions.

The focus of this post has been on the lack of engagement with the community. Our next post will evaluate the actual review and compare it with other councils.

Cardinia – https://www.cardinia.vic.gov.au/news/draft-planning-scheme-review-part-b-public-exhibition

Mornington Peninsula – https://shape.mornpen.vic.gov.au/mps-planning-scheme-review-2026

Moonee Valley – https://yoursay.mvcc.vic.gov.au/planning-scheme-review

Mansfield – https://www.mansfield.vic.gov.au/community/news/local-knowledge-sought-2026-planning-scheme-review

Macedon Ranges – https://yoursay.mrsc.vic.gov.au/Planning-Scheme-Review

Yarra Ranges – https://shaping.yarraranges.vic.gov.au/yarra-ranges-planning-scheme-review-2026

Mansfield – https://www.mansfield.vic.gov.au/community/news/local-knowledge-sought-2026-planning-scheme-review

Kingston – https://www.yourkingstonyoursay.com.au/planning-scheme-review

Greater Dandenong – https://yoursay.greaterdandenong.vic.gov.au/strategic-planning-work-program

Whittlesea – https://www.whittlesea.vic.gov.au/Services/Building-planning-and-development/Strategic-planning/Planning-scheme-and-amendments/Planning-scheme-review

South Gippsland – https://www.southgippsland.vic.gov.au/PlanningSchemeReview2026

Baw Baw – https://www.bawbawconnect.com.au/planning-scheme-amendment-c157bawb South Gippsland – https://www.facebook.com/southgippslandshirecouncil/posts/-were-reviewing-the-south-gippsland-planning-scheme-and-we-want-you-to-share-you/1475486824605666/
The agenda for the upcoming council meeting includes the 2025/26 Annual Report. We have previously commented on the lack of detail (and therefore transparency) especially in relation to the Urban Forest Strategy and the goal of increasing our overall tree canopy to 22% by 2040.

The following is conclusive proof that we are indeed going backwards when it comes to our tree canopy. All of these figures are taken from the respective Annual Reports. What they clearly show is:

  1. A failure in the past 5 years to nominate the number of ‘replacement’ trees. Hence, we have no idea as to whether Glen Eira is increasing its number of trees, or falling further behind. Also, please remember that these numbers do not include what has been happening on private property.
  2. The numbers of ‘new’ trees planted was relatively steady (approx. 1000 per annum) up until 2019/20. Since then, it has been on a downward spiral.

Here is the data:

2011/12 – 1,684 street trees (526 replacement and 1,158 additional)

2012/13 – Plant 1,600 street trees (estimated to be 1,000 replacement trees and 600 additional trees).

2013/14 – We planted 1,681 street trees (1,080 replacement and 601 additional) and lifted the number of future plantings to 2,000 per year.

2014/15 – We planted 2,360 street trees (1,360 replacement and 1,000 additional)

2015/16 – We planted 1,050 replacement and 950 additional street trees.

2016/17 – . 2090 trees planted

2017/18 – . We planted 2,038 street trees (913 replacement and 1,125 additional)

2018/19 –  We planted 2,077 street trees (940 replacement and 1,137 additional).

2019/20 –  We planted 950 street trees (684 replacement and 266 additional) which was 1,050 under target due to COVID-19 restrictions.

2020/21 – We planted 1,854 trees (854 replacement and 1,000 additional).

2021/22 – 1008 trees planted

2022/23 – 872 trees planted

2023/24 – 2,241 trees planted

2024/25 – 1,189 trees planted in streets, parks and reserves

2025/26 –  1003 trees planted

At last council meeting this public question was asked –

At the May 19 meeting, Council agreed to provide a summary of outcomes of the final State Government’s Carnegie Activity Centre plan vs Council’s Structure Plan on Council’s website so changes would be clear to the Glen Eira community. With the release of the finalized plans for the Stage 2 Activity Centres last Friday, when will that Carnegie information be available and will Council provide similar detailed explanations for all the Stage 2 Activity Centres?

Answer:

Council placed an update to the Carnegie Structure Plan 2022-Amendment C237 webpage on 19th June 2026. This included information relating to the state led activity centre plan for Carnegie approved under Amendment C278. This update included changes to over shadowing controls between the two plans.

Now that the Stage 2 plans have been released, we will provide a more detailed summary of the differences between the State led activity centre plans and Council’s Structure Plans for Bentleigh, Caulfield and Glen Huntly by this Friday, 3 July. The state led plan for Elsternwick only refers to a range of heights associated with the Elsternwick Structure Plan. The plan does not illustrate how this height range is applied to different sites within the Elsternwick core. Therefore, a summary of the state led plan and Council’s plan for Elsternwick can only be prepared once further information is released by the State Government. To note, the final controls for Stage 2 activity centre plans are yet to be issued so there may be further changes Council is not currently aware of.

COMMENTS

We have repeatedly bemoaned the fact that this council is determined to keep its residents ignorant of the significance of changes made by the State Government and how these changes will impact all ratepayers across the municipality. When public questions have to be repeated ad nauseum, and the responses and ensuing actions fail to provide the information required then we conclude once again that the objective is to fully comply with whatever is handed down by government and to treat residents with disdain.

We have finally located the so called ‘summary’ referred to above and affecting Carnegie – buried deep within council’s website and unlike Bayside Council certainly not on the council’s home page. And instead of a detailed and comprehensive summary of what the changes actually mean, the only comment made is in relation to the new overshadowing requirements. Not a word about heights, setbacks, building separation, etc. Instead of patting themselves on the back that one overshadowing requirement has now become mandatory at the equinox, rather than the solstice, council totally ignores all the other important changes.

Here’s council’s interpretation of what truly informing residents means: Please also note the use of language and how deliberately misleading it is. For example: we are told that the government amendment C278 REPLICATES what council proposed with its original Carnegie structure plan. Dictionary definitions of the word tell us that ‘replicate’ means to ‘make an exact copy’. Nothing could be further from the truth in this instance!!!!!!!

Planning Scheme Amendment C278 

The Minister for Planning has approved Amendment C278glen (Implementing the Carnegie Structure Plan) which replicates the proposed council-led Amendment C237glen.  

Amendment C278glen implements the key strategic directions of the Carnegie Structure Plan 2022 as proposed by Amendment C237 but replaces the Design and Development Overlay Schedule 9 (DDO9) with Built Form Overlay Schedule 4 (BFO4). The new BFO4 has been applied to the commercial core of the Carnegie Activity Centre. This change to replace a DDO with a BFO was made by the Department of Transport and Planning (DTP) to give effect to the State Government’s Train and Tram Zone Activity Centres Program. 

The BFO was developed by DTP as part of their Activity Centres Program to provide opportunities to streamline planning assessments and support housing growth in and around activity centres. 

The Amendment approved by the Minister implements the Carnegie Structure Plan 2022 in relation to the main commercial core area. The surrounding residential was rezoned to HCTZ under the Activity Centres Program and does not form part of this Amendment. 

Amendment C278 deletes the existing Design and Development Overlay (replaced by the BFO) and also makes consequential changes to local policy within the Glen Eira Scheme. 

Some notable changes to the council adopted version of Amendment C237glen made by Amendment C278glen include: 

  • Appling mandatory equinox overshadowing controls to the Woorayl Street Reserve rather than mandatory winter solstice controls. (noting that the independent planning panel had recommended applying a discretionary equinox control rather than the mandatory winter solstice Council was originally seeking). The final decision to apply the mandatory equinox control is considered a reasonable outcome. 
  • Amend the wording to clarify that the overshadowing requirement for the active recreation space below the Skyrail immediately west of Koornang Road is a discretionary equinox control applying between 10am–2pm. 

Nothing in the above can or should be seen as an accurate summation of what has changed!

Here are some changes not even mentioned in this so called ‘summary’.

  • Building separation in one instance has gone from the original 9 metres to 6 metres for buildings over 28 metres
  • Setbacks that were previously mandatory for the heritage sites are now discretionary
  • Building heights in several locations have gone from 31 metres to 46 metres

Until we get an honest council that is fully committed to its residents and properly overseen by councillors nothing will change!

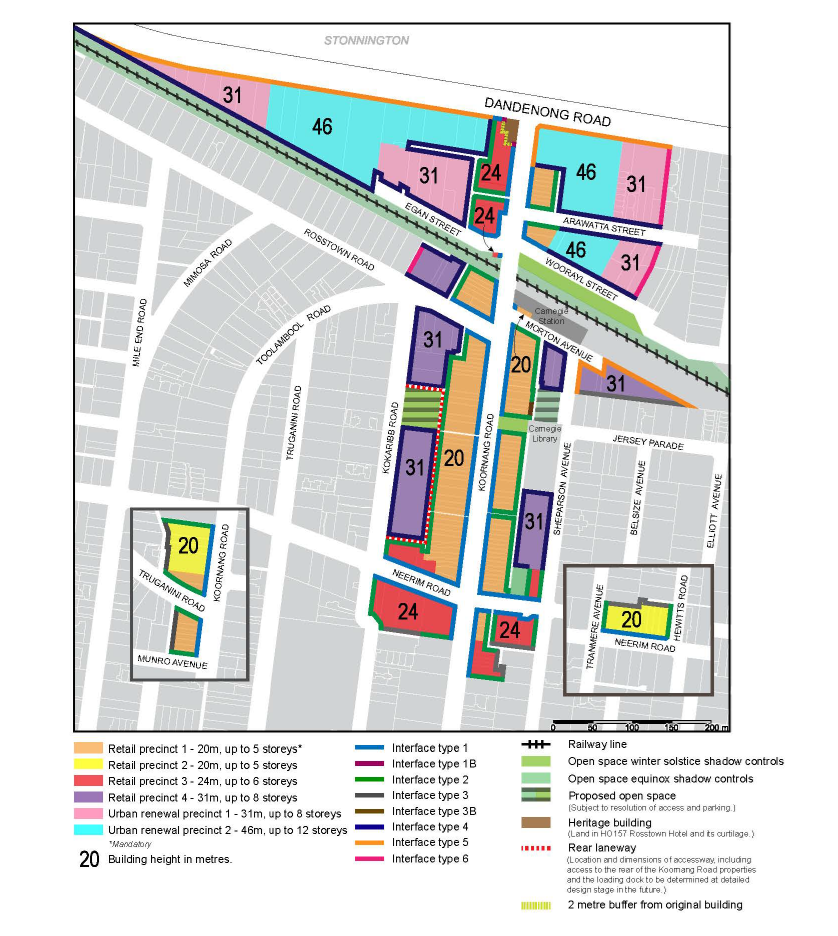
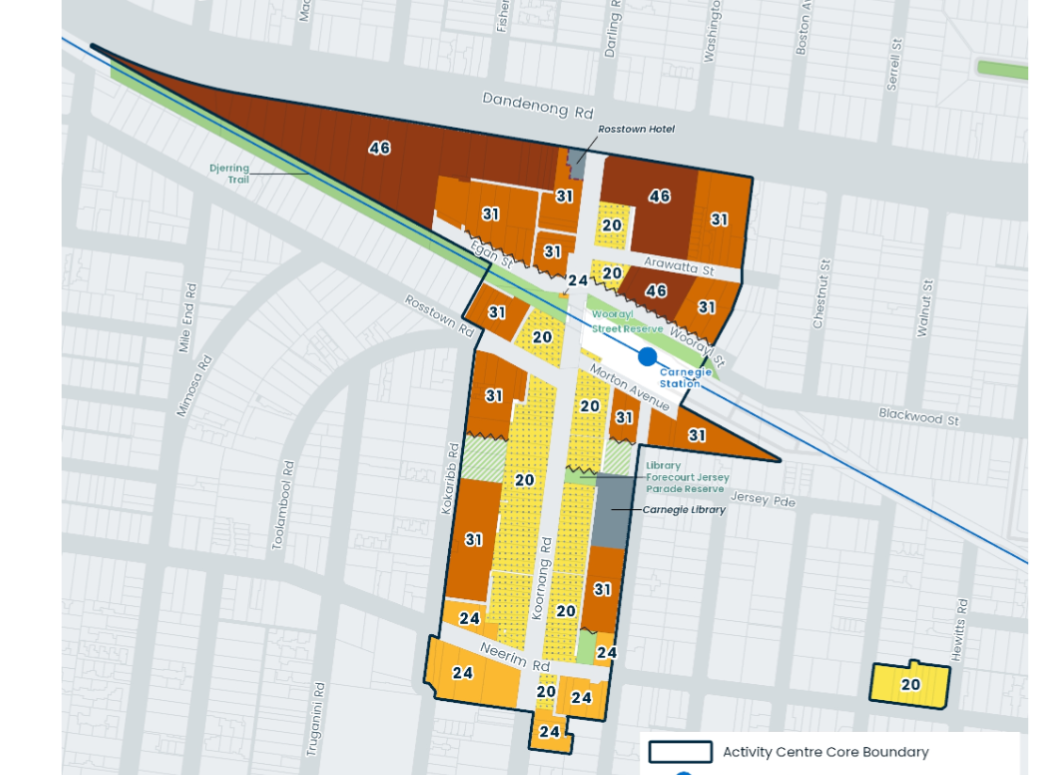
Finally, please compare the following two maps outlining heights. The first is from council’s structure plan and the second the government change –

Bayside council takes fight for secret activity centre plans to court

Annika Smethurst

June 23, 2026 — 4:10pm

Bayside council has launched a court bid to access secret government documents which could pave the way for a broader legal challenge to the Allan government’s controversial plan to strip councils of their planning powers.

Documents, filed in the Supreme Court, reveal Bayside City Council wants the court to order Planning Minister Sonya Kilkenny to hand over ministerial briefs and advice that she relied on when approving a controversial planning amendment for 25 activity centres.

The amendment overrides local government regulations in nine council areas and allows increased height limits and reduced planning barriers around transport hubs.

Bayside Council takes in the suburbs of Brighton, Brighton East, Hampton and Hampton East – four of the 25 designated activity centres.

The request for documents could force the release of advice, modelling and briefing documents underpinning the government’s decision to fast track high-density housing across nine Melbourne council areas including Banyule, Boroondara, Darebin, Glen Eira, Maribyrnong, Merri-bek, Monash and Stonnington.

The filing marks an escalation in the spat between the state government and councils over the planning reforms, which Labor argues will accelerate the approvals process and allow more houses in some of Melbourne’s best-connected suburbs where housing growth had slowed.

In a statement, Bayside Council said it was seeking to understand how planning decisions were made, including how particular areas, such as Bayside, were selected.

Bayside Mayor Debbie Taylor-Haynes said the council had a responsibility to chase the information on behalf of the community.

“This legal process is about transparency. Our community deserves to understand what sits behind a decision of this scale that could significantly reshape their neighbourhoods,” Taylor-Haynes said.

“Residents are asking fair questions about how these decisions were made, and what evidence informed the government’s approach. Council has sought this information through letters and freedom-of-information requests and been refused. We are now taking this next step to obtain the documents needed to properly inform our community.”

To justify its planning takeover, the government has repeatedly pointed to the slower growth in established suburbs compared to the city’s outer fringes.

In council areas such as Melton and Wyndham, housing grew by 433 per cent and 346 per cent respectively over the past 30 years. By comparison, inner-suburban council areas like Boroondara and Bayside grew by 24 per cent and 28 per cent respectively over the same period.

A spokesperson for the government told The Age it was focused on building more homes for young Victorians.

“Well-connected suburbs like Brighton and Kew can’t stay locked up forever while outer suburbs do the heavy lifting when it comes to building new homes,” the spokesperson said.

“As this matter is before the courts, it would be inappropriate to comment further.”

The state government has indicated it will challenge the application.

The case will come before the court on Wednesday for a directions hearing.

The legal action comes as affected councils continue to express frustration over the government’s plan to relax planning rules to boost supply and improve affordability, over concern about a lack of consultation and fears the changes will alter neighbourhood character and impact local amenities.

Local Liberal MP James Newbury said the Bayside Council had shown “incredible courage” by standing up to the Allan government, and described Labor as a “bully” determined “on wrecking our community”.

“Bayside is like David standing up to whack Goliath in the nose. Every Council should find the same courage,” he said.

Source: https://www.theage.com.au/politics/victoria/bayside-council-takes-fight-for-secret-activity-centre-plans-to-court-20260623-p609ch.html

SOME THOUGHTS

In contrast to Glen Eira, Bayside is at least putting its money where its mouth is! We applaud their courage in taking on the state government – regardless of the outcome.

Glen Eira in its various submissions to government has continually stated that no evidence has been forthcoming to justify the tsunami of amendments that have been imposed on councils. That’s where Glen Eira stops.

We have no doubt that if a survey was taken today of Glen Eira residents, more than 80% would have no idea of what is happening in their suburbs as a result of government changes. Council’s website does not highlight the impact of these changes. In fact a public question asked on the 19th May and the promise made, is yet to eventuate – that is 5 weeks ago!!!!!

Here’s the question and answer:

Amendment C237glen Carnegie Structure Plan was formally lapsed on 14/5/26. The Victorian Government’s website for its recently finalised Carnegie Activity Centre plan does not provide the detail for what has been adopted/what has not been adopted out of the Carnegie Structure Plan into their Carnegie Activity Centre plan. We therefore request Council to provide a detailed comparison on Council’s website to help inform residents of Carnegie and Glen Eira

Response

The Minister for Planning has approved Amendment C278glen, which implements the state led activity centre plan for Carnegie. This largely replicates Council’s proposed Amendment C237glen, the Carnegie Structure Plan. This amendment introduces the new Built Form Overlay (BFO) control, which applies to the same core area identified in the adopted Carnegie Structure Plan.

In general terms, the building heights now established across the main commercial core are broadly consistent with those outlined in the Carnegie Structure Plan.

Council will provide a summary on its website outlining which elements of the Structure Plan have been directly translated into the planning controls, and where any variations have occurred

The resident’s question implied far more than the structure plan. It basically asks what changes have occurred to the entire activity centre. This council has not answered. Instead resorting to a focus on the structure plan itself – which basically covers only the commercial strip – and ignoring the impact on surrounding residential areas. Please also note the euphemisms employed – ie ‘generally consistent’; ‘in general terms’; ‘broadly consistent’’

We have repeatedly highlighted how other councils (Bayside, Boroondara, Stonnington) have websites that prominently feature the impacts on their municipalities of these government amendments. Residents of Glen Eira would be hard pressed to find any such information from their council. Why the reluctance to inform and/or educate? Why should it take at least 5 weeks to action a promise that was made? Why can other councils hold public forums and Glen Eira does nothing? Why can we only conclude that keeping the public ignorant is a sign of compliance by this administration and councillors?

Unbelievable is an understatement!!! It is simply staggering that after nearly 5 years since introducing an Urban Forest Strategy, and proclaiming time and time again how combating climate change and tree canopy loss is a top priority, Council has no idea as to how many canopy trees have been lost on private land – the major factor in our decreasing canopy. What this means is, that there is absolutely no way of determining whether the Urban Forest Strategy  and its target goal for canopy increase is in fact a ‘success’ or a dismal failure – despite all the spin and more policy introductions such as the Local Law.

Following a question to council, we finally have an admission as to how little attention has been paid to our environment and its long term sustainability. Here is the relevant question and the answer:

QUESTION: Council in its Urban Forest Strategy has identified that tree canopy removal on private land is largely responsible for the municipality’s overall tree canopy reduction over the past two decades. The latest agenda states in Item 10.4 that “Since the adoption of the Local Law in August 2024, Council has issued 662 canopy tree local law permits” This however does not reveal how many trees are involved in these permits. Therefore, my question is: of these 662 permits, how many canopy trees were actually granted approval for removal as opposed to simply the number of permits granted?

RESPONSE

At Glen Eira Council, the local law is administered per site and not per tree, so only one application is required for a property regardless of how many trees are being removed. Some permits may also include both removal and pruning of trees on sites. As such, we are unable to provide a specific number of trees that have been removed without manually checking each permit and what it allows. We are currently in the process of updating our records system to capture this information in the future.

Perhaps the above also explains the following:

  • Annual reports and quarterly reports proudly state the numbers of trees planted in parks and streets. But since 2021 or so, we have never been told how many trees are ‘replacement’ – ie how many have been lost! It’s all very well to keep stating ‘we are planting 1000 or 2000 trees per annum. But if we lose 800-1000 each year, is this actually increasing our tree canopy, or are we going backwards? Is the refusal to publish, or even keep such data, a cover up, where lip service and ineffectual policies replace positive action and proper funding?
  • When the Tree Canopy Protection Law was introduced, any refusal to grant a permit for tree removal  could be challenged via a formal objection. This objection would then be considered at a full council meeting with the relevant documentation made public. Councillors would then vote and decide whether or not to grant a permit for removal. This has now disappeared. Everything is decided by officers. Thus, there is no transparency and certainly no accountability as to why the various decisions have been made. We doubt that councillors are even aware of why and how many of these decisions occur.

Nothing appears to have halted moonscaping in our residential streets. We therefore are putting out a request to our readers. If you are driving or walking past a moonscaped site please forward us the address or even better, a photo of the site. We will endeavour to follow up and discover how many trees have been lost and why this has been permitted! Only when there is full transparency and decent funding can we truly believe that this council is fair dinkum in decreasing our appalling history of canopy loss.

Email us at: gedebates@gmail.com

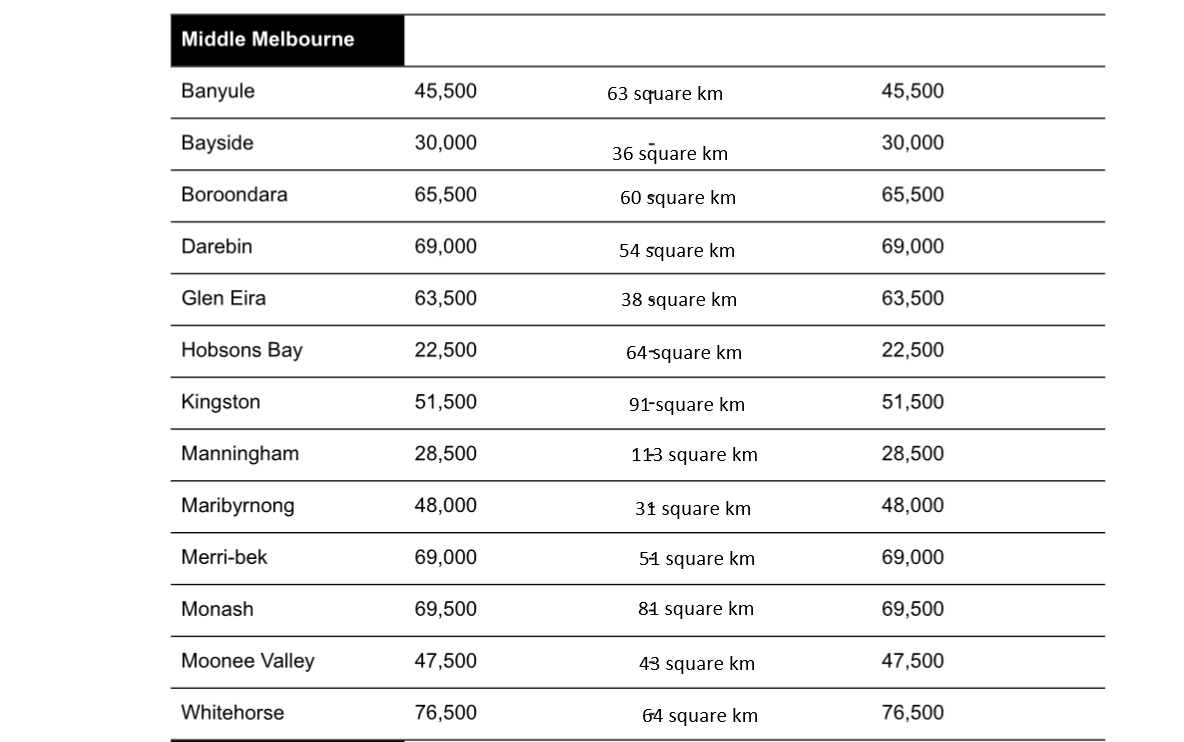
We have scoured both government and council documents and nowhere is there to be found any mention of what might constitute appropriate population density. Instead we have ‘population targets’ that councils are meant to achieve by 2051. The latest gazetted government amendment contains the following table. We have included the size of each of these municipalities.

Glen Eira is expected to accommodate another 63,500 new residents. Council is happy with 55,000. Please check out one of our previous posts on this issue and council’s lame response to these  targets. (https://gleneira.blog/2024/08/20/councils-stand-on-housing-targets/)

No one is denying that our population is increasing and that housing is required. What we do question is why should Glen Eira be expected to accommodate 63,500 new residents in an area that is one of the smallest in the middle ring suburbs. Other councils that are told to increase their populations by 60,000+ are often double the size of Glen Eira!

On the projected population figures forecast for our cohort of councils Bayside currently has a density factor of 2882 persons per square km; Boroondara 2968; Darebin 3041; Kingston 1841; Manninghanm 1173; Marybyrong 3041; Merribek 3712; Monash 2601 and Whitehorse 2884. None of this has been taken into account. (Source: profile.id.com.au)

If we take an even closer look at what is happening in Glen Eira (circa 2025) we find the following breakdown of our suburbs.

The City of Glen Eira Estimated Resident Population for 2025 is 163,025, with a population density of 4,216 persons per square km. (source: https://profile.id.com.au/glen-eira)

SuburbPopulationArea – Square KmDensity/pop per square km
Bentleigh19,1084.814141
Bentleigh East32,3048.983598
Carnegie20,5503.695575
Caulfield North & East20,0565.453677
Caulfield South13,0733.273996
Caulfield6,1531.474178
Caulfield North20,0565.453677
Elsternwick & Gardenvale12,8272.864485
Glen Huntly5,6430.896318
McKinnon7,4481.594689
Murrumbeena10,8422.634125
Ormond9,6322.074650
St.Kilda East4,5790.964789

Add another 63,500 residents and our population per square km approaches 5961 persons. And even if we build enough homes to house this population, what does it mean for liveability, infrastructure, open space, overshadowing, schools, hospitals, traffic, etc. etc. etc. None of this has been taken into account, yet it is the crucial question that needs to be addressed. Do we really want, or even need, to become the Calcutta of the south east and forego all that we value as basic residential standards and environment?

Submissions on the state government’s latest planning travesties, close on March 22nd, 2026. Glen Eira council has put up several media releases encouraging residents to view the Engage Victoria website and hopefully, submit their views. Is this enough however? Interestingly, the February 2026 council media release concluded with this sentence:

We encourage everyone to learn more and share their views via the Victorian Government’s Engage Victoria website at www.engage.vic.gov.au/traintramzones.

Do residents really ‘learn more’ by reading the government spin? Do they achieve anything from a survey that is unashamedly geared towards confirming proposed planning changes? If we are correct in characterising the Engage Victoria exercise as nothing more than another sham consultation, then what is, and should be, the roles of councils?

Should councils, cut through the spin and provide residents with:

  • A clear summary of proposed height changes for all activity centres nominated?
  • Debunk government claims when and where appropriate?
  • Provide clear statements as to the impact of proposed changes on heritage, environment, sustainable development, traffic, infrastructure, open space, economy, density, and scores of other potential impacts?

March 22nd is literally days away and we are yet to see council’s submission. On Tuesday there was a council meeting. Why was there no submission presented? Does this mean that residents will not be privy to the submission that is eventually submitted? Or will we be shown this submission only after it has already gone in? Why can Stonnington get off its backside and produce a superb submission that was tabled at their March 16th council meeting?  Given that councils have had plenty of warning as to closing dates, why haven’t we seen anything from Glen Eira?

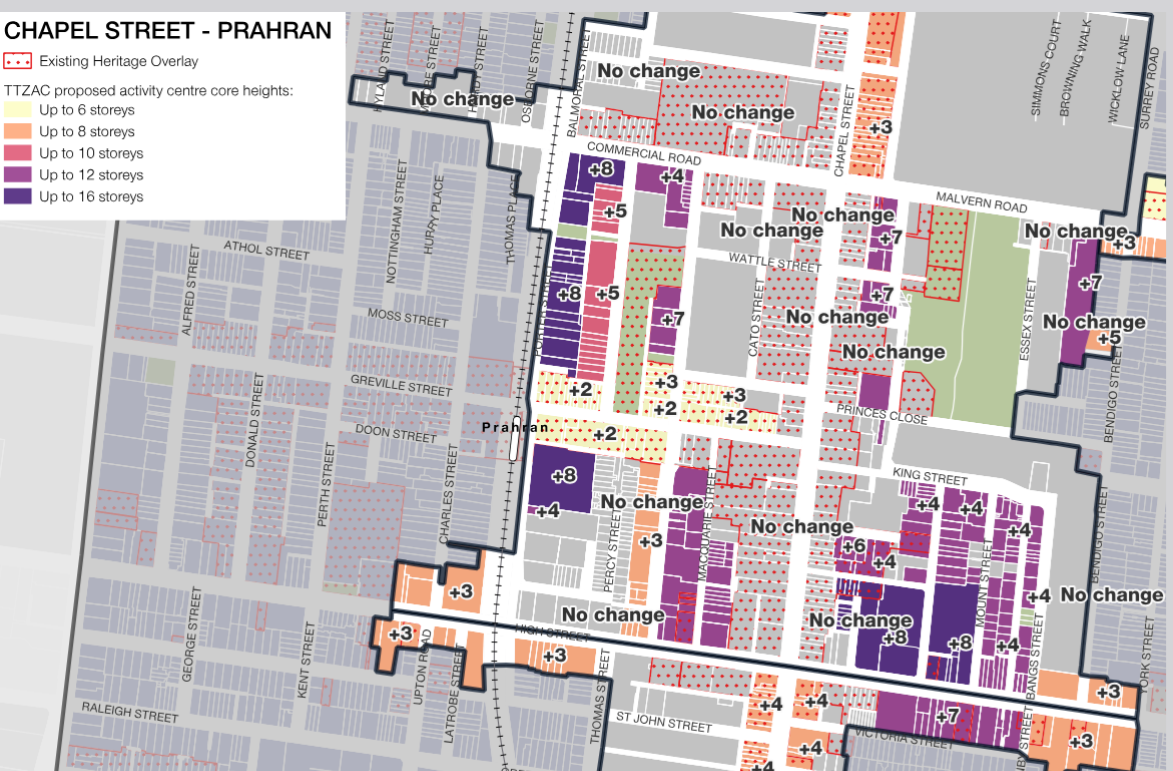
What we find as particularly impressive about the Stonnington submission and its information sharing with the community is the series of maps which show residents exactly what is proposed. Here is one of these maps:

It is difficult to be any clearer than the above. Residents can immediately see the current planning controls regarding the increases in proposed heights. In Glen Eira none of this has really been spelt out for the community.

Stonnington has also engaged its own consultants to do 3D planning analyses, as well as breaking down how much of their municipality is likely to be changed. They claim that 70% of Stonnington will covered by the activity centre planning proposals. When one looks at what is proposed for Glen Eira we think that it is even higher for our municipality. Will Glen Eira even bother to do this work to ‘inform’ residents? We doubt it!!!!!

Finally a few quotes taken from the Stonnington March 16th submission and the accompanying officer’s report –

The proposed heights exceed those established within Stonnington’s existing strategic work as shown in Council’s height comparison maps at Attachment 3. This is likely to impact the heritage significance and character of our historic streetscapes, undermine pedestrian scale, reduce sunlight to streets and parks, and detract from residential amenity.

An alternative extent and application of Housing Choice and Transport Zones (HCTZ1 and HCTZ2) is recommended based on local conditions. Stonnington’s approach excludes areas with heritage and neighbourhood character overlays, and alters the application of the HCTZ (from HCTZ1 to HCTZ2) to existing and proposed Neighbourhood Residential Zones (NRZ) in the Housing Strategy

There is a disconnect between the stated objectives of the Activity Centres Program and the Stage 2 maps released for consultation. No modelling, testing, sight line diagrams or analysis has been provided to demonstrate how these maps meet these design principles. It is unclear what setbacks would apply to street and residential interfaces to manage adverse impacts associated with tall buildings. Council’s modelling shows some of these principles, such as ‘sunny streets’ cannot be met by the heights proposed

State Government’s Activity Centres Program has been progressed over a short timeframe by using a consistent approach across metropolitan Melbourne to activity centre planning. As a result, their maps are not adequately tailored to local conditions.

Nor are they informed by an evidence base, such as built form modelling and testing that provide an understanding of heritage impacts, sunlight access, wind, views from the public realm and neighbouring sites

The State Government’s Train and Tram Zone Activity Centres (TTZAC) Program (including the Chadstone pilot centre) affects a large proportion of land within Stonnington – as shown in the adjacent figure. Approximately 70 per cent per cent of Stonnington is impacted.

In the absence of growth targets per centre, it is unclear if the level of change proposed is purposefully (and effectively) meeting this stated outcome. Transparent targets would provide a baseline understanding of how much housing, employment and services the areas need to accommodate over time. Without this context, decisions about building heights and density and infrastructure upgrades risk being ad hoc or misaligned with the needs of the community and may not take into account the existing development that has occurred across these major centres

The proposed inner and outer catchments include highly valued heritage precincts with some of the most substantially intact, consistent Victorian, Federation and interwar housing in Stonnington. Approximately one third of the properties within the residential area proposed for the Housing Choice and Transport Zone (HCTZ) with increased heights is covered by a Heritage Overlay or a Neighbourhood Character Overlay. Most of these areas along with residential streets of consistent character are currently within the Neighbourhood Residential Zone or General Residential Zone with a 9m height limit (2 storeys), whereas heights of between 3-6 storeys will now be allowed.

Whilst the State Government has stated that existing Heritage Overlays will remain in place with planning permit triggers and assessment unchanged, the proposed controls create an inherent tension by establishing an underlying zone promoting higher growth.

The existing NRZ includes this relevant purpose ‘To manage and ensure that development is responsive to the identified neighbourhood character, heritage, environmental or landscape characteristics’ which will no longer apply when it’s rezoned to the HCTZ.

The areas identified for increased density and growth (Housing Choice and Transport Zone) appear to apply blanket zoning changes without any clear justification beyond distance to the centre. The inner catchment has been applied to areas adjacent to the centre regardless of clear constraints such as Heritage Overlays, Neighbourhood Character Overlays and flooding risk.

Stonnington’s adopted Housing Strategy has considered building heights within the catchments, and provides a context-responsive approach, allowing for realistic levels of growth based on existing constraints and opportunities.

Council considers that all areas where precinct Heritage Overlays or Neighbourhood Character Overlays apply, should be removed from the proposed inner or outer catchment.

We received the following email from a resident in response to our post on council’s desire to raise the rate to 5% for the following financial year. Here’s what was written:

Hello – there is another aspect – being the difference between Local Government Receipts that are not taxed and the community “worker/family” cash on hand to pay rates – which they have to earn and pay for their rates “after tax”.

The increase from 2.75% to 5.0% is an effective 2.25% increase or 81.82%

 increase on the effective rate (as always for any small percentage base) Local Government benefits as they do not pay tax on their receipts. But communities under economic and wage strain – the families the councils say are also vulnerable and others which are under cost of living pressure with high mortgages and families to feed only have after tax dollars to pay those rates


If Glen Eira is saying the average rate is ~$1,600 then a resident has to earn $2,080 to have the $1,600 cash (based on 28% tax +2% Medicare levy). The Council collected $113m in rates yet the before tax impact on residents (with assumptions) would be close to$146,900,000.
If now Glen Eira is saying to increase rates to 5% (2.25% addition to the base 2.75% – an 81% increase) then for the resident to pay the $1,600 X 5% next year = $1,680. But that is not where it stops. For the resident to earn $1,680 in the bank before tax they have to have gross wages of $2,184 – that is a part cause of inflation and the cost of living stress. Over 71,000 (and rising) number of rateable properties x the difference between $2,184 and $2,080 =$104 x 71,000 = $7.38 M – taken from Glen Eira before tax wages.


The potential rate increase is not good local government policy when balanced against the need and strategies to support communities – and their Health and Wellbeing plans, especially when the 2025 budget demonstrated an excess of $5M, which could be/should have been held aside, in trust, to assist with next years cash so called “stress”.


Fluff and bubble really – and blindness to the real world… really. Forensic real costs convert wages paid by employers to before tax – on the basis of statistics and “$1 for $1 equal  basis” with Local Government who do not pay tax.


(We do not have a mortgage and we are fortunate – but the argument above is for the wider good)

Item 10.1 of the latest council agenda, contains this paragraph and its recommendation:

This report recommends moving forward on this a key element of the Strategy. It proposes a one-year 2.25 per cent variation above the announced rate cap of 2.75% for 2026–27, a total increase of 5 per cent in 2026–27 generating approximately $3 million additional rate revenue per year

The officer’s report goes on to claim that overall the community supports council’s ambition to increase rates and this is ‘evidenced’ by an enormous round of community consultation held over the past few years.

This approach reflects strong community input over the past two years. Through comprehensive engagement programs such as Our Priorities, Our Future (2023) and Our Place, Our Plan (2025), more than 3,200 participants took part in conversations about priorities, trade-offs and funding options. In the 2023 deliberative Community Priorities Panel, 73 per cent of members supported applying for a rate cap variation as part of a broader package of measures to strengthen Council’s financial sustainability.

Sounds great, doesn’t it? – 73% supporting a rate increase!!!!! A clear majority. However, when you go back to the actual Community Priorities Panel report, we can be forgiven for thinking that this is truly representative of the community. Please bear in mind that this committee consisted of up to 39 members only and therefore hardly constituting what could be considered as genuine community representation. Hardly surprising however that the report chooses to highlight this percentage and provides no other stats from the various surveys!!!!

Even when we investigate the results from the community survey on Our Priorities, Our Future, we find the following:

• The community may be open to increasing fees and/or charges to maintain current service levels, with 52 per cent of the community responding in the ‘maybe’ range, but ‘no’ is the most common single response at 37 per cent.

Please note the phrasing of the question. Instead of calling a spade a spade, (ie rate increase) the terminology becomes ‘fees and/or charges’. This is entirely different to a rate increase and we have no idea whether participants simply saw this as raising child care fees, entry costs to swimming pools, etc instead of reading this as an increase to rates.

When the question was finally asked as to how council’s finances could be increased and the methodology council should employ to achieve this, only 10% (166 responses) were in favour of rate increases.

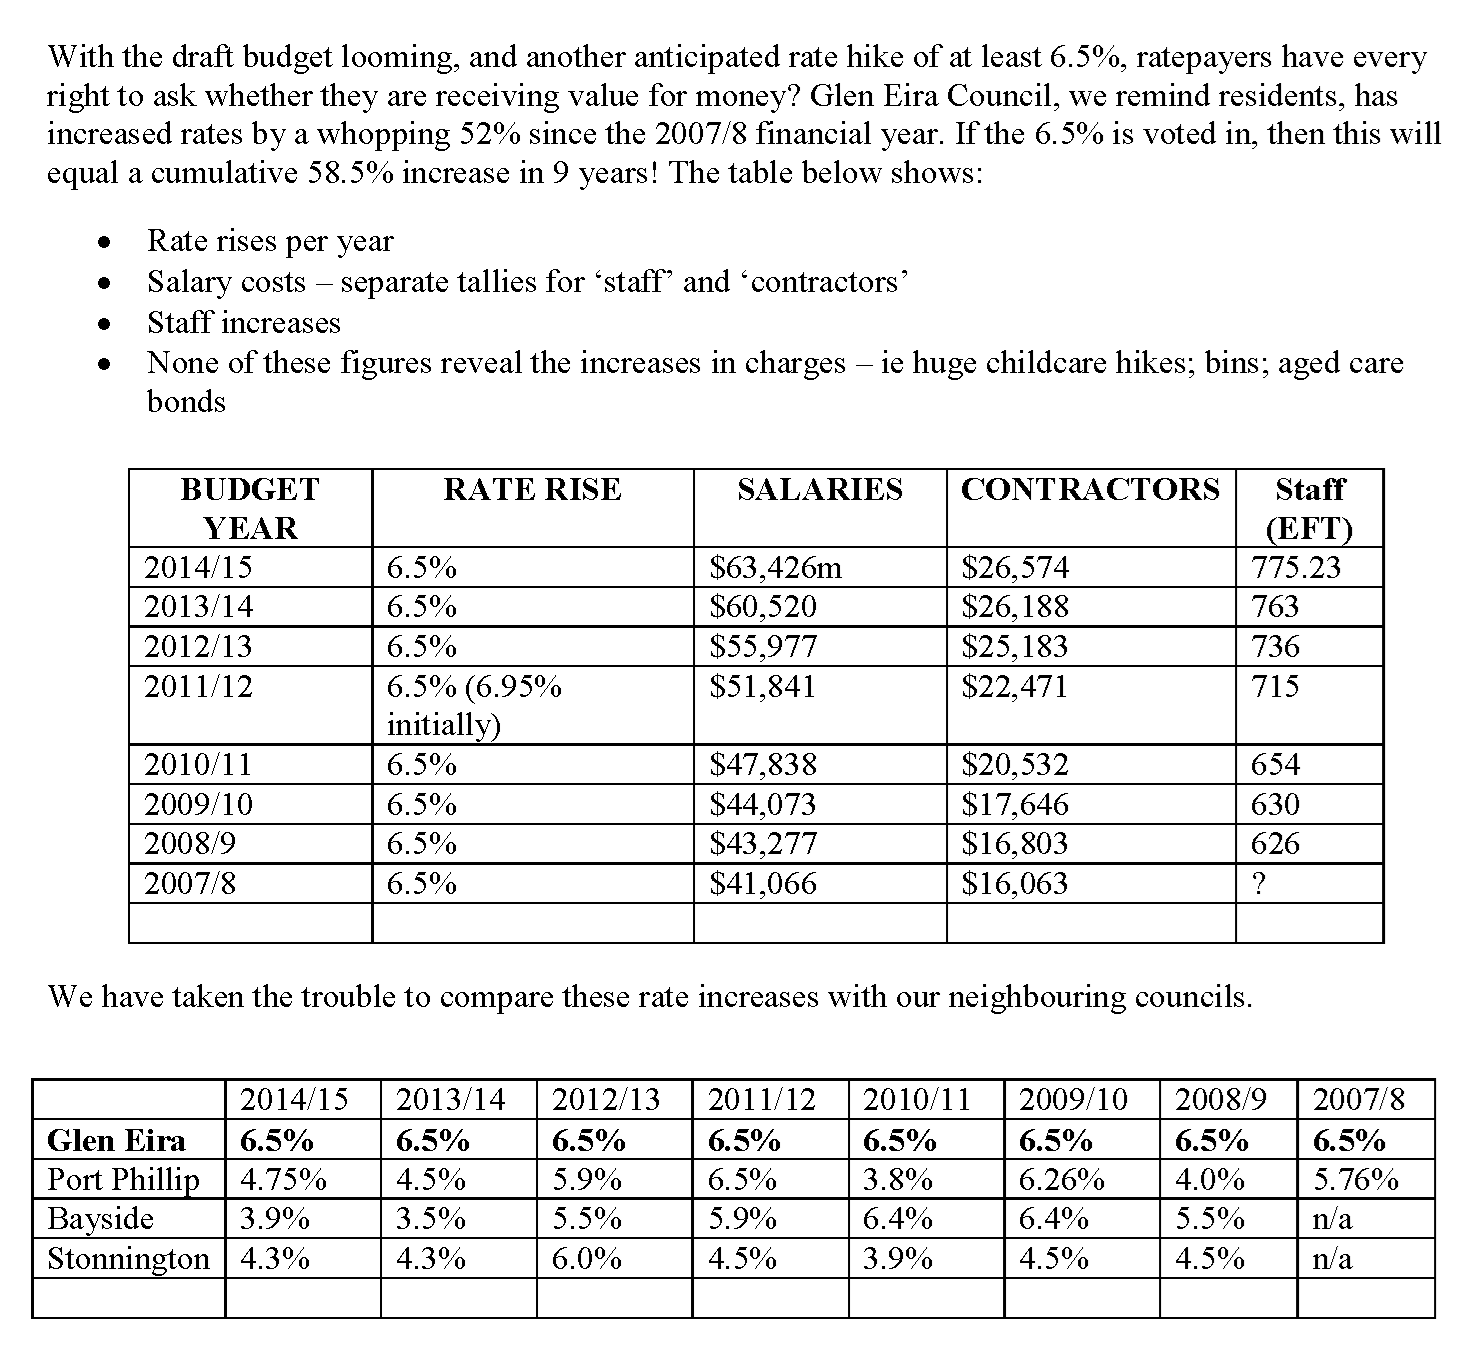
Even more disturbing is council’s continued refrain, that Glen Eira residents have ‘some of the lowest rates in Victoria’. When rates are calculated, please remember that this is done according to property/site value. Clearly many Bayside suburbs would have a greater site value than those in Glen Eira, and the same could be said for Stonnington. Therefore their overall rates would be higher in these municipalities. But what also needs to be taken into account is not just the final rate, but the INTEREST RATE per annum which is applied to all properties. For well over a decade preceding the state government’s rate capping introduction (2016/17) Glen Eira was the highest by far in comparison to our neighbouring municipalities. Here is a comparison we made in April 2015 –

CONCLUSION

We do not doubt that prices for everything have increased dramatically. Nor do we doubt that governments have cut back on grants and attempted to pass on more costs to councils. But does any of this really justify a 5% rate increase across the board – especially in these times and when this is backed up by some very spurious claims as to overall community support.  Could we for once get an officer’s report that is not misleading and fabricated to evince councillor support?

The bottom line of course is how well council has run our finances. Did we really need an $80M mini GESAC pool? Did we really need to embark on gigantic loans that will take another decade to pay off? Questions abound. At the core is the issue of whether or not this council is truly listening to residents.

Not for the first time do we have to query the accuracy of a council report. We refer to the current agenda item 10.6. This is supposed to be an analysis of housing development in Glen Eira for the period 2021-2024.

Council has provided the following tables:

We have taken the time to go through council’s planning register to see whether these figures actually stand up to scrutiny. To make things as simple as possible, we decided to concentrate on the multi-dwelling applications for the year 2024 since this is the smallest category and thus less time consuming. Council tells us that for this category of dwellings there were only 23 applications decided in 2024 and that the total number of dwellings approved as a result of these applications was a paltry 142 dwellings (highlighted in yellow in the above image).

But council’s own planning register tells a completely different story and its only for this category of dwellings. We haven’t gone through the other categories as yet.

Listed further below are all the multi-unit applications, the number of proposed dwellings, and the dates when permits approving developments were issued. We’ve also sure that we’ve probably missed a few to boot. Several include ‘amended permits’ granted. However, we can only assume that development would not have started prior to the granting of the amendment.

Casting further doubt on council’s analysis is the failure to state the number of dwellings associated with several of these applications – and they are all large developments. For example: Horne Street, 600 North Road (8 Storeys); 144 Hawthorn Road (6 storeys). We make a conservative estimate that we’re looking at least another 100 dwellings just from these few applications.

Our tally comes up with the following numbers:

35 applications decided, (as opposed to councils claim of 23) and

246 dwellings approved (as opposed to council’s claim of 142) (PLUS THE APPROX 100 NOT LISTED AS DESCRIBED ABOVE.)

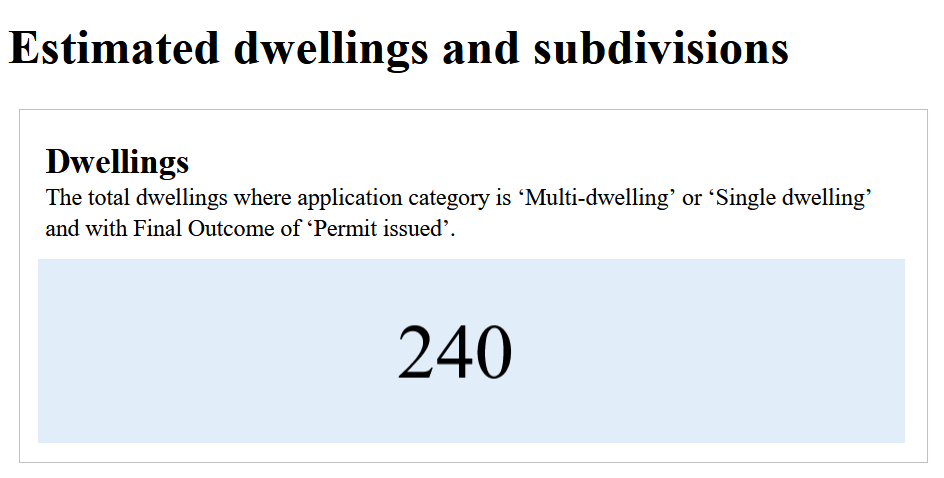
How can there be such a discrepancy between this report and council’s own planning register? Even when we’ve tried to correlate the above figures with the state government’s Planning Activity Website, there is a major difference between council’s numbers and what they are obliged to report to government. We limited our search to the 2024 calendar year as well as only residential development and permits granted in this year. The results show:

Admittedly the above figure of 240 also includes ‘single dwellings’ but these are only a minority and would not alter the discrepancy between council’s claim of only 142 new dwellings constructed.

Is it too much to therefore ask that council’s reports are beyond question? And how come that for the last few years, council’s budgets have all claimed to be based on approximately 1000 new rateable properties for each year? Why do we keep getting such rubbery figures? Is it incompetence, laziness, or merely a mindset to produce data that supports hidden agendas?

Finally please have a read of all the approved permit applications we list below:

216 Hawthorn Road CAULFIELD NORTH, 4 dwellings – 13/12/2024

7-15 Horne Street Elsternwick – no of dwellings not stated – amended permit issued 11/11/2024

52 Hill Street Bentleigh East – 4 dwellings – 18/10/2024

2 Rusden Street Elsternwick – 5 x 3 storey – 16/12/2024

168 Hawthorn Road Caulfield North – 4 x3 storey – amended permit – 21/8/2024

98-100 Truganini Road Carnegie – 12 dwellings – amended permit – 10/10/2024

1 Anderson Street Caulfield – 4 double storeys – amended permit – 12/12/2024

86 Bignell Road Bentleigh East – 3 double storeys – 17/10/2024

600-604 North Road Ormond – 8 storey building but no. of dwellings not listed – amended permit 21/11/2024

259 Orrong Road St Kilda East – 3 double storeys – 9/10/2024

9 Station Avenue McKinnon – 8 double storeys – amended permit issued – 14/6/2024

21 George Street Bentleigh East – 3 double storeys – 3/10/2024

583 North Road Ormond – 4 dwellings – 6/11/2024

15 Leamington Crescent Caulfield East – 3 double storeys – amended permit 20/2/2024

Unit 1 and Unit 2 1 Francesco Street Bentleigh East – 7 x 3 storey – 19/7/2024

136 Tucker Road Bentleigh – 3 double storeys – amended permit 19/4/2024

34-36 Jersey Parade Carnegie – 4 storey, 18 dwellings – 13/6/2024

1 and 1A Stephens Street Caulfield – 4 double storeys – 23/4/2024

71 McKinnon Road Mckinnon – 3 double storeys – 11/7/2024

6 Cobar Street Bentleigh East – 4 double storeys – 16/4/2024

Units 1 and 2, 49 Kangaroo Road Murrumbeena – 3 dwellings – 17/5/2024

30 Hobart Road Murrumbeena – 4 double storeys – 29/5/2024

108 Patterson Road and 70 Railway Crescent Bentleigh – 4 dwellings – amended 30/1/2024

35-39 Murrumbeena Road Murrumbeena – 32 apartments and 2 townhouses – 11/10/2024

144 Hawthorn Road Caulfield North – 6 storey, no of dwellings not stated – amended permit 24.1.2024

292 Hawthorn Road Caulfield – 13 dwellings – amended permit 31/5/2024

216 Hawthorn Road Caulfield North – 5 dwellings – 19/2/2024

51 Clarence Street Elsternwick – 4 dwellings – 19/2/2024

296 Jasper Road Mckinnon – 3 double storeys – 16/1/2024

679-683 Glen Huntly Road Caulfield – 6 storey, 50 dwellings – amended permit – 30/1/2024

23 Loranne Street Bentleigh – 3 dwellings – 12/6/2024

Unit 1-3 14 James Street Glen Huntly – 5 dwellings – amended permit – 29/5/2024

11 Perth Street Murrumbeena – 5 x 3 storeys – amended permit – 31/5/2024

52 Whitmuir Road McKinnon – 4 dwellings – 21/3/2024

226 Hawthorn Road, Caulfield North – 7 dwellings – 22/1/2024

Next Page »