PS: we’ve neglected to mention another two major applications in Horne St. One is for 7 storeys and another for 9 storeys!
Elsternwick is, and has always been designated as a Major Activity Centre together with Carnegie and Bentleigh from the year dot. Thus when council announced its Planning Scheme Review and the start of the structure planning process, for some unaccountable reason, Elsternwick was not given a guernsey as part of the initial work plan. The excuse offered by councillors was that according to the popularity poll (aka survey) taken at the time it did not feature as prominently as Bentleigh and Carnegie. Six months later however, there was a change of heart with no explanation. Now Elsternwick is joining Bentleigh, Carnegie and Virginia Estate as first cabs off the rank for structure plans.
The problem though is far, far worse for Elsternwick since it does not have any interim height amendments that were granted to Bentleigh and Carnegie. Now that council has resolved to seek a year’s extension, that means that Elsternwick is open slather for developers for at least another 2 years if not longer.
It is worth speculating on the possible reasons for this situation –
- Has council, or the department, or the minister always seen Elsternwick as fertile ground for massive high rise? What meetings, discussions, secret deals have possibly been made?
- Have developers already come knocking on council’s doors and delaying any amendment is the result?
- Since when does a shonky ‘survey’ constitute the rationale to overlook what the planning scheme says about ‘urban villages’? Worth remembering the outcry from Elsternwick residents when the draft concept plans (including 12 storeys) was announced and the claim was that residents weren’t sufficiently informed. If they weren’t informed about this, then what are the chances that they weren’t informed about some silly little ‘survey’?
- And doesn’t the published draft plans substantiate council’s wish to turn Elsternwick into a high rise suburb?
This is already occurring. Here are two current applications that have yet to be decided – but given the lack of any protection, and the unlikelihood that anything will be in place until at least 2019, Elsternwick has been left to the wolves.
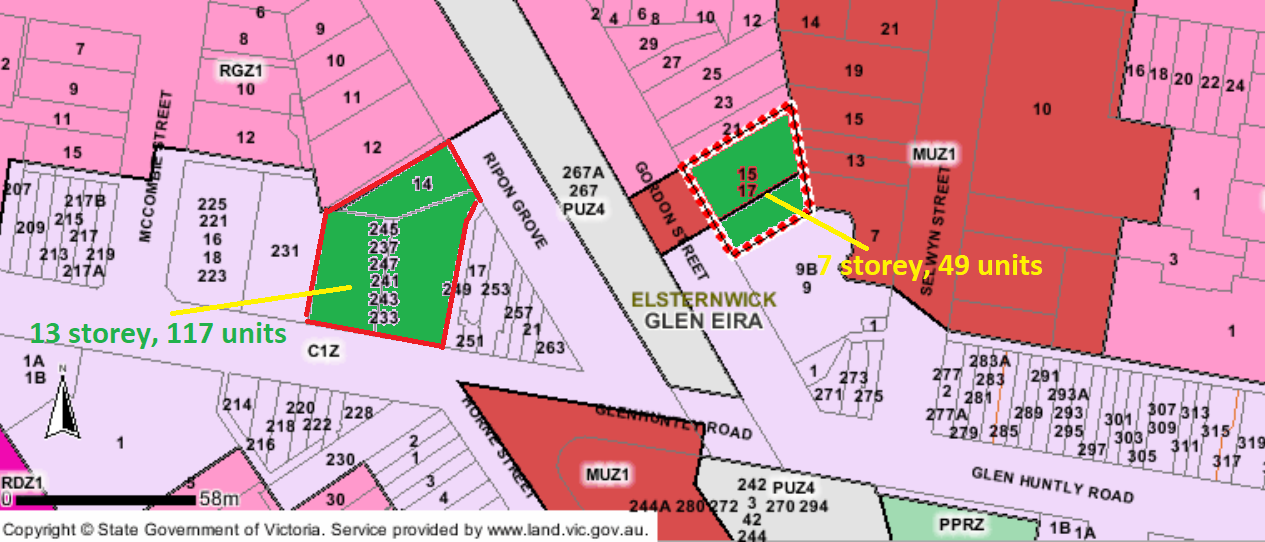
15-19 Gordon Street ELSTERNWICK VIC 3185 – Demolition of existing building and construction of a seven (7) storey building containing up to 47 dwellings and food and drink premises, reduction in statutory car parking requirement and buildings and works in a Heritage Overlay
233-247 Glen Huntly Road ELSTERNWICK VIC 3185 & 14 Ripon Grove ELSTERNWICK VIC 3185 – Construction of a multi-level mixed use development including 117 dwellings, up to 13 storeys plus basement, reduction in visitor car parking and waiver of loading bay requirements
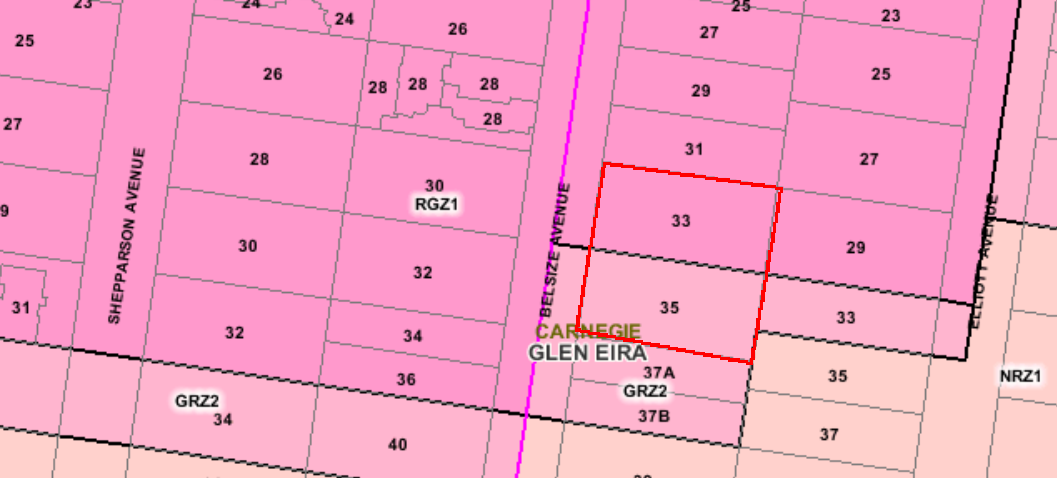
And just to add more salt into the wounds, the currently proposed change for 10 St Georges Road ELSTERNWICK from its zoning of 4 storeys down to 2 storeys has an application in for – Demolition of existing dwelling and construction of a four storey apartment building comprising twelve (12) dwellings above basement car park and reduction of visitor car parking requirements on land affected by the Heritage Overlay PLUS an application for ‘demolition’ even before heritage or the planning application is sorted out!
Readers should note that the application for 13 storeys will sit alongside what council proposes to be 2 storeys if it gets up. (See below). Much like Chestnut Street in Carnegie. There is also much more scope for development with the ABC studios/Ripponlea, Gordon Street, etc. etc. How on earth council didn’t know this was all on the cards and work diligently to ensure that Elsternwick was included in the earliest work plans is unfathomable – unless of course, collusion or straight out incompetence have played a major role here!